14 Surefire Probability Math Projects Kids Will Love (Even if They Hate Math!)
When math is a nightmare for your kid (or student), teaching them new concepts or helping them with homework can be like pulling teeth.
But with a little help from these fun yet helpful math projects, you are sure to give them a swell time learning math, whether at home or in the classroom. Using this technique gives probability math a complete makeover, grounding in key concepts they need to learn all about simple probability.
This article goes over 14 of the best probability math projects you can do with your students or kids at home. Half of those are for middle schoolers, the other half for high schoolers. But most are easily adjustable to almost any age!
By the way, if your kid needs even more fun in their math (or is it the other way round?), be sure to check out my article on algebra projects and activities.
Probability Math Activities for Middle School Kids
#1. Pick and Go (Classroom Fun)
The beauty of introducing icebreakers in a classroom environment is that you ‘break away’ from the passive routines school imposes on your pupils or even you as a teacher. Through active learning, fun classroom activities grants a certain level of mastery of the things learnt in class– this activity included.
Knowing that, put some more action to your craft with this project which interestingly introduces simple concepts like sample space in simple probability.
What you’ll need
- A sizable cardboard box.
- Different colored scrunchies.
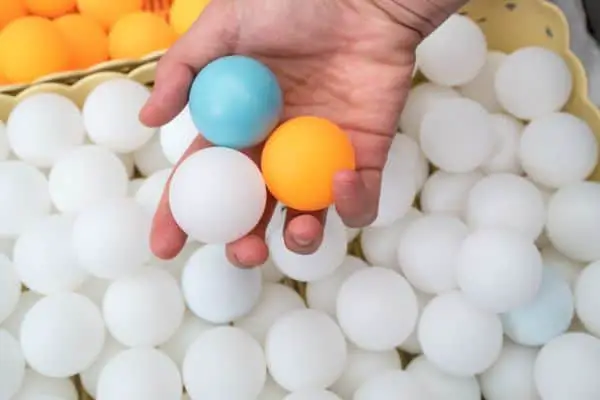
- Different colored sponge balls matching the scrunchies. (Ping pong balls would do too. But if you don’t have them, grab a batch of cheap foam toy balls.)
Activity
To get them started, prepare the balls and organize them into clusters, matching each color per set. Make sure to engage each member in the process at least once.
More often than not, I realize that my learners tend to enjoy activities more when they do things together in teams. No wonder I’m a huge fan of team work!
Select a random number of balls, noting the numbers down somewhere, and place them inside the box in front of the class. To make it more competitive, split the class into groups and have them pick one ball from the box in turns.
For every pick, tally the colors on the board and award the same colored scrunchie to the team member with the pick.
Repeat the activity with a different number of balls for every color.
What they learn
The best part of this project is asking them the mind-boggling questions, making sure to ask for their predictions too.
From the activity, they should learn that sample space entails the entire population of the probability experiment. The ball with the highest number of occurrences in the box has a higher chance for pick up than the rest.
It should also be clear to them that their predictions should lean on the side of the color with the highest scrunchie per team.
This could also be a good chance to teach fractions involved with probability math.
#2. Prize Wheel (Spin & Win)

When you run out of new math concepts to teach, it’s easy to resort to past ideas to get you going through the semester. Luckily enough, you don’t have to!
Prize wheels are common in most places that kids visit like malls. It would be easier for them to relate some notions learnt in class with what they see in real life– and that’s exactly what this is.
You’ll need to step out of the box for this one, giving it a dose of creativity to make it as fun as possible.
What you’ll need
You don’t need to complicate it that much (just make sure your rewards last till the wheel is ready).
- Cardboard boxes – preferably three large ones.
- Different colored marker pens for decorations (you can use water colors).
- Small bolts and nuts for the pivot.
- Rewards – preferably edibles ones.
- Cutting blade.
- Glue.
Activity
- Using the cutting blade, cut out three circular wheels of about 25 inches in diameter.
- For each wheel, divide the entire circumference into varied fractions with tiny and large portions.
- Now the fun part! Decorate the rewards in the divided fractions awarding your best rewards to the tiny fractions and less wanted ones to the larger fractions.
- To make the base, cut out two triangular frames for each wheel with a height slightly higher than the diameter of the wheel. This ensures that the wheel doesn’t touch the surface it’s been placed on.
- Make holes about an inch near the tip of the triangle, gluing the nuts in place.
- Make a hole of a slightly larger diameter compared to the bolt’s diameter.
- Firmly attach two of the cut out triangles together leaving about an inch of space in between the triangles. You can use thick strips of the cardboard box with glue to accomplish this.
- Position the wheel at the center of the triangular base and align the holes then screw in the bolt to suspend the wheel.
- To make the fraction picker, you can make and decorate an arrow then attach it to the top of the triangle pointing upwards.
Give the learners a chance to express themselves through artwork in the process to get the wheel decorated.
How to play
The primary objective here is to establish that it is indeed a game of calculated risk. It accurately describes what probability really is: a calculated chance or likelihood of something happening.
Your budding geniuses can first make a bid on what they want, then spin the wheel and see the results.
If they land on what they had predicted, then they get the reward.
Why are the bigger fractions easy to get?
#3. Probability Table (A Yummy Project!)
For you to make math interesting, you must be a little creative. Towards the end of the last semester, I was out to try out a physical fractions math activity with my class. Unfortunately, I left home in a hurry that day and forgot the materials I needed for the activity.
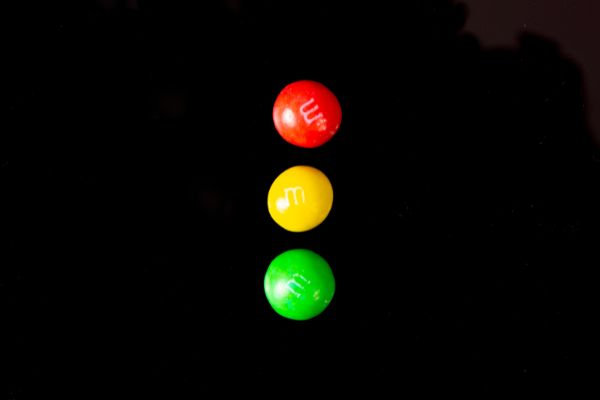
Luckily, I had 3 packs of M&Ms in my drawer and that’s when the magic began.
Knowing the fundamentals of how to map probability spectrums in an intuitive but interesting way can easily scale up your learners’ comprehension of the concept of probability.
In this activity, you’ll learn of a fun way to show how likely something is likely to happen using just candy, two cups, and a piece of paper.
How cool is that?
What you’ll need
- 4 packs of M&Ms (preferably of different flavors).
- 8 plastic cups.
- A marker pen.
- Large plain pieces of paper.
Activity
Split the class into 4 groups. For each group, give out one pack of the flavors you got alongside two plastic cups.
To prepare the probability table, follow these steps:
- Draw a 3 by 4 table using the marker pen.
- Arrange different pieces of M&Ms along the rows and columns of the table.
- Fill out a demo on the board to show the different combinations one can pick from each cup then let them try to figure out how to fill up their individual group tables.
Confirm that the table is right for each group as you offer insight on why the table looks the way it looks. For deeper understanding, now proceed to pick one piece from each cup then show the probability from the table.
They can now proceed with the exercise till all the M&Ms are picked. This is also a very good time to show them that all probabilities should add up to 1 for one probability experiment.
Prepare follow up questions to check if they understood the concept.
What is the probability of picking a yellow and red M&M?
#4. The Last Banana (Strategic Thinking)
The number one reason why students always report finding probability a challenging topic in math surveys is because the system tends to take a more bland and fixed approach at teaching it.
Not to put a blame on faulty reliance on formula mastery, don’t get me wrong. Probability requires a strategic thinking approach.
This involves visual and engaging activities like this one.
Try out this popular probability thought experiment with your kid to challenge the way they think about rolling dice.
What you’ll need
- Bananas.
- Pieces of paper.
- Dice.
Activity
This thought experiment aims to flex those brain muscles to make a decision to pick a side which is likely to win. It requires two players.
Tell them to assume they are stranded on an island and that there is only one banana left.
They decide to roll two dice to see who wins the banana and there is only one condition. Player 1 wins only if the highest number rolled in either 1, 2, 3 or 4 and player 2 wins if the highest number rolled is either 5 or 6.
Now one person picks a side that is likely and the rolling begins.
After the activity, you should explain to them why player 2 in each group was more likely to win the banana despite the limited set of die faces to win.
Take the two-way table approach as illustrated in the video below:
#5. Knock Out (Equal Chances)
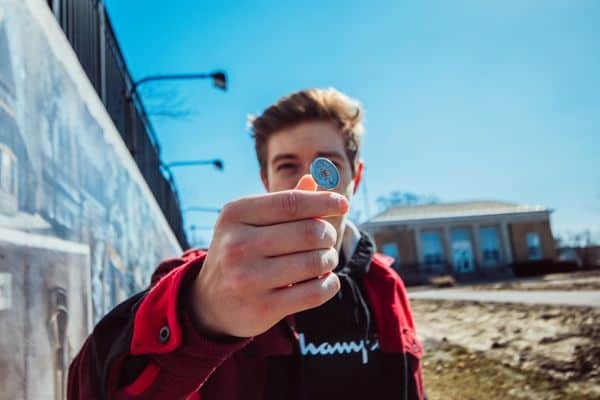
It is worth acknowledging that some events have an equal chance of occurrence. Taking a perfect example of an unbiased coin, for every toss, there is an equal likelihood that you’ll get a head as there is for you to get a tail.
With an introduction of a point system, you can turn this important lesson into a fun math activity so that probability math freight changes to delight.
What you’ll need
- Coins.
- Plain pieces of paper.
What to do
Pair up your participants in groups of two then give each group a coin.
- Tell each group to draw a T table with members’ names on the columns.
- Each member should take a turn to toss the coin.
- Before every toss, one picks a side.
- For every correct guess, 5 points are awarded and every loss two are deducted.
- The first member to reach 100 knocks the other out of the game.
After the activity, they should be able to tell that the coin has an equal probability of landing on either side.
#6. Take the Shot (Proximity)
Probability math doesn’t just stop existing when you close your math textbooks. There is a lot going on around us that involves probability math. This one uses physical education to teach us some probability.
As a plus, you not only work out your kids brain muscles with this activity but also those leg muscles.
What you’ll need
- A basketball.
- A basketball hoop.
Activity
Your participant can take turns to take shots from different distances from the hoop. You can take shots from the 3-point line, the inner box, under the rim, and the free shot mark.
It should be obvious that proximity to the rim affects the probability of making a shot. Shots taken from below the rim are more likely to enter the rim compared to ones taken from the 3-point mark.
#7. Bottle Balance
Towards the peak of COVID back in 2020, bottle balancing was rapidly becoming a popular trending among kids on the internet. I was wondering why all the hype till I tried it myself.
I was in awe of how thrilling this activity was.
That’s when I first came up with this idea as a math activity. You’ll be shocked how probability gets in.
What you’ll need
- Water bottles.
- Some water.
What to do
It’s best if this activity is carried out in groups.
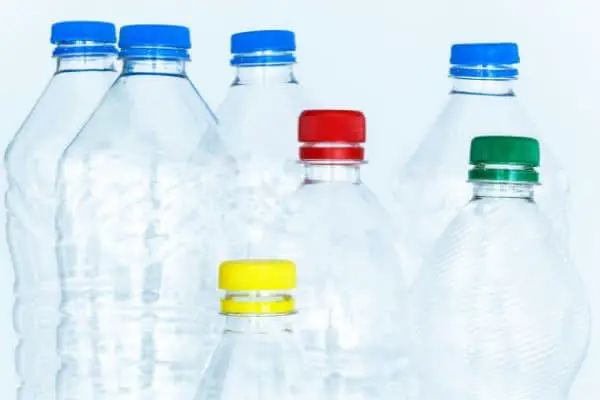
- Fill up the bottles with different levels of water for each group.
- Let members try to flip the bottles and balance them on tables.
Takeaway
Water bottles that were almost half filled were more likely to balance on the table compared to ones that were almost full.
Empty bottles were almost impossible to balance.
You can tabulate the results to display the probabilities for each bottle.
Probability Math Projects & Activities for High Schoolers
Prerequisites
The probability of an event occurring is shown as P(E). The mathematical representation is P(E) = n(E) / n(S).
n(E) represents the number of expected outcomes while n(S) represents the sample space, which is the total number of possible outcomes.
Dependent vs Independent Events
When we talk about dependence in probability, we refer to how the occurrence of events affects each other’s probability of occurrence. Therefore by extrapolation, dependent events are events whose occurrences affect the probability of occurrence of other events.
Independent events are events whose occurrences don’t have an impact on the probability of occurrence of other events.
Now let’s take a look at practical examples that demonstrate the above explanations.
#8. Dependent Events – Pick a Card
I particularly like this activity because it readily lends itself to a more realistic hands-on experience, leave alone being cheap and simple to accomplish.
What you’ll need
- A deck of cards.
- A small box of different colored marbles.
Activity
Shuffle the deck of cards properly and set it aside. Place the box of marble on top of a table and ask your participant(s) to pick one color at random without looking. Repeat the exercise a couple of times without replacing the marbles.
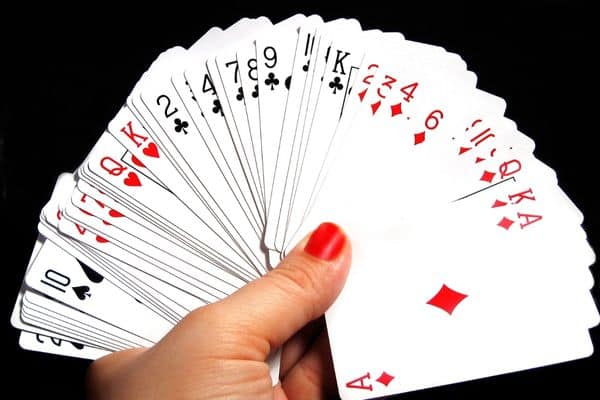
Now to the cards. Ask the participant(s) to randomly pick:
- A black king then a 7.
- A queen then a black card.
Discussion
By the end of the experiment, the students should have realized the first event affects the probability of the second event.
Evidently, after drawing a card from the deck, the sample space changes, and so does the probability of picking another card. This also holds for the box of marbles.
Ask the students to calculate the probabilities of different mock scenarios to make sure that they get the concept.
#9. Independent Events – Toss and Roll
We’ll borrow from the conventional coin toss and die roll experiments used to study the probability distribution of independent events in statistics.
What you’ll need
- A die.
- A fair coin.
Activity
Start the experiment by telling the participant(s) to roll a die a specific number of times. Each time, tell them to note down the face that appears and study the trend accordingly.
Next, proceed to the coin which is to be tossed, and the resulting face tallied on a table.
For example, you can roll the die six times and toss the coin ten times. From this, you kill two birds with one stone. They will learn how to draw probability distribution tables as well as familiarize themselves with independent events in probability and how to identify them.
Discussion
It should be clear at the end of the experiment that there is no trend in how the outcomes appear in the table. No matter how much the coin produces a consistent streak of either a head or a tail, you can never really predict the next outcome with certainty.
The probability of getting any face in the coin toss experiment is concluded as P(E) = ½ = 0.5 while that of getting one face comes down to P(E) = ⅙ = 0.333.
Simple vs Compound Probability
Simple probability entails the probability of a particular event ever occurring. It represents the probability of one independent event.
On the other hand, compound probability represents the probability of two or more events occurring at the same time. The two events can either be disjointed or have a union.
This is a good time to teach them how to calculate probabilities of compound events as well as identify which events are mutually exclusive.
#10. Simple Probability – Where’s the Bunny?
I recently learned to appreciate the role of feedback from my students and that has come a long way to assist me to develop most of my projects. For this first part, you can try being quirky with your manipulatives. At least that is what most of my students liked from previous classes!
By the way, if this activity sounds a bit silly, don’t let it fool you. No matter how “metal” they like to act, teens actually enjoy occasional silliness!
What you’ll need
- Cardboard box.
- Marker pen.
- A pair of scissors.
- Glue.
What to do
Your creativity can be a good tool here as you are to draw animal characters on cards.
- Cut 6 rectangular cards from the cardboard box.
- Draw 6 different animals on paper, one of them being a colored bunny.
- Glue the drawings to the cards.
Activity
Flip the cards on a table and ask the participant(s) to pick out the card with the bunny. After every attempt, shuffle the cards and ask them to pick one more time.
To make it more interesting, you can introduce a reward for every correct prediction.
You should also ask them to tell you the probability of picking the bunny and not picking the bunny.
#11. Compound Probability – The Gray Elephant

This old chestnut has been in use for a long time and almost always guarantees more than half the chances of success.
It’s by far the easiest to perform as you only have to carry out a study on your participants.
Activity
Take a sample of your participants and isolate them. Read to them a list of 10 countries and 6 animals which must include 4 starting with the letter D, among them Denmark, and 3 starting with the letter E, among them Elephant.
Call them one by one to the front of the class.
First, ask them to solve a simple math problem whose solution should always result in 4.
Then explain that the answer translates to a letter in the alphabet following the order: 1=A, 2=B, 3=C, 4=D…
That means the letter chosen will always be D.
On a timer, ask them to quickly guess a country beginning with the letter D, an animal that begins with the second letter of the country, and finally the animal’s color.
Almost all the time, you will get the gray elephant. To calculate the compound probability of getting the gray elephant, use P(E) = P(D) x P(E).
It’s imperative to emphasize that compound probability is the product of the probability of each event tested in an experiment.
Probability Tree Diagrams
Probability tree diagrams are used mostly by statisticians to plot the probability distribution or events in an experiment. A probability tree diagram, as the name suggests, resembles a tilted tree-like structure representing the probability of occurrence of each event in its branches.
They are plotted from the left to the right and a complete branch represents the compound probability of more than one event.
#12. The Raffle Draw
This activity mimics the lottery system and tends to explain how slim the chances of winning the jackpot in a raffle ticket draw are.
What you’ll need
- 5 cardboard boxes.
- 10 red, blue, and green sponge balls.
- Glue.
- A pair of scissors.
What to do
- Number the cardboard boxes from A to E using a marker pen.
- Make circular paper cut-outs with a diameter of about 1 inch each.
- Write numbers on the paper cut-outs from 1 to 100.
- Randomly glue the paper cut-outs to any of the sponge balls until all of them are labeled.
- Shuffle the balls and then place 10 balls in each box.
- Cut small strips of paper and make tickets with five randomly guessed numbers on each.
Activity
To play the raffle draw, your participants first buy tickets from you (Easy, they don’t have to use real money). From the ticket sales, you can prize your jackpot, making sure you earn a profit after giving out the win.
To get the winning ticket, pick one ball at random from each box and display it to the participant(s). The first lucky number comes from the first box and goes for the other lucky numbers.
Prizes are awarded only to winners with tickets having more than 3 matching numbers. Tickets are sold every time there is no winning ticket.
As you can already predict, the chances of someone getting all five correct numbers are almost zero.
Give a demonstration of how to plot the probability tree diagram of the first lucky number. Remember that the numbers are not placed in order, which makes it a little bit challenging but they will figure it out.
Now arrange numbers 1 – 20 in box A, 21 – 40 in box B, and so on.
What is the probability of winning with 16, 27, 42, 78, and 99?
Conditional vs Unconditional Probability
Conditional probability refers to the probability of an event occurring given that some event or events have already occurred. It is tied to the relationship between the expected event and the event that has already taken place. Represented as P(B|A).
In contrast, unconditional probability refers to the likelihood that an event will take place irrespective of the presence of any prior conditions.
The multiplication rule is a crucial tool for understanding what happens in experiments with multiple steps such as the one discussed below.
As I always insist, I love to have my learners team up for these activities– I hear some great math talk.
#13. Pick the Joker
In this activity, you are required to pick either a black or red card and calculate the probability of picking the right card according to a prescribed condition.
What you’ll need
- A deck of cards.
- Red and black marker pen.
- Plain white paper.
- A pair of scissors.
What to do
- First, shuffle the cards and place them on a table.
- Make 2 index cards using the paper and a pair of scissors.
- Paint one index card, red, and the other one, black.
Activity
First, let them know that the card they are looking for is either a black or red joker card. Then draw a card from the stack. Depending on the color of the card you have picked, lift the corresponding index card.
From the color choice, they are supposed to tell you the probability that the card you just drew is a joker. Do note that after drawing cards, the sample space changes.
The targeted card switches color after every failed attempt. For example, assuming they start looking for a red joker card, if they fail in the first attempt, the next target becomes a black joker card.
Hint: The conditional probability is calculated as P(B|A) = P(A and B) / P(A). Also, the probability of getting a black joker card given the card drawn is red, is 0.
You should repeat the exercise until the participants get the right card (joker card).
#14. Unconditional Probability
What you’ll need
- Three cardboard boxes.
- Red, blue, and green sponge balls.
What to do
You can use red, green, and blue sponge balls to demonstrate unconditional probability. Borrowing from the Pick and Go activity (scroll above to find it), mix the balls and place them in three different boxes on a table.
Pick one ball from the first box, say red, then ask them the probability of picking another red ball given you already have a red ball from the first box.
It may not seem apparent to them at first, but the first event doesn’t have an effect on the probability of occurrence of the event.
It’s worth noting that unconditional probability very closely resembles the probability of independent events.
Frequently Asked Questions
What are some probability math projects for middle school?
Some probability math projects for middle school you can try out include the last banana, the gallery walk, and pick and go. These activities require no mastery but rather shape your learner’s approach when tackling probability problems. If you need more inspiration, check out my compilation of best math activities for the school breaks!
What are simple experiments you can use for probability?
Picking a card from a deck of cards, tossing a coin, balancing a bottle, and spinning a prize wheel are simple experiments for learning probability. For every event, there is one and only one outcome.
What are examples of probability games?
Probability games that you can use to teach probability include the Blackjack, Yahtzee, and Backgammon. Probability games are a good way to learn how to take a strategic thinking approach to learn probability.
What is the conditional probability formula?
The conditional probability formula is P(B|A) = P(A and B) / P(A) and is mathematically derived from the probability multiplication rule P(A and B) = P(A)*P(B|A). To further simplify this, you can express it as P(A∪B) which is the union of A and B.
What is theoretical probability in math?
Theoretical probability in math can be defined as probability achieved by calculation without any experimental event analysis. A textbook example involves analyzing the probabilities of rolling different faces of a die without actually performing the experiment.